


 ЧЪРкДхФФ ОпАЃЛѓДу ПРЧТ
 11ГтПЌМг МвКёРкИИСЗ 1РЇ
 ГЛАд ИТДТ ОюЧаПј УЃБт
 ИЎОѓ ЧаБГ ЙцЙЎБт
 СжИЛПЁ ГЛАЁ ОЕ КёПыРК?
 УжАэАЁМККё РЬКЅЦЎ СёБтБт
 ЧіСіПЁМЕЕ ЧЪРкДхФФ!
 ЧіСіПЁМ АЁДЩЧб


 ЧЪРк ЦЏБо Ч§ХУ! ФСНУОюСі МКёНК


 АЁСЗПЌМіЗЮ ДйЧдАд ОзЦМКёЦМ


|
 |


- РЬИЇ : han3
- РлМКРЯ : 2019-01-30
- СЖШИМі : 2207
- УпУЕМі : 0
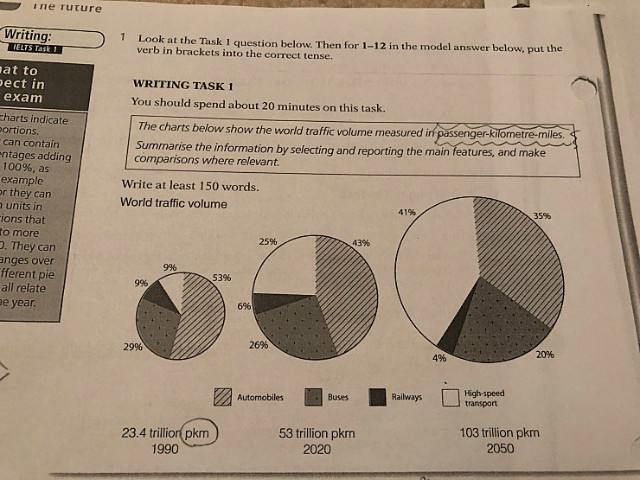
The pie charts illustrate the changes in the proportion of pmk for range of different forms of transport every thirty years between 1990 and 2050 along with the total number of passenger kilometres.
The most striking feature of the chart is the rise in traffic volume from high speed transport. It is expected to see a dramatic increase, climbing from just 9% of traffic volume in 1990 to 25%, and then 41% in2020 and 2050 respectively. By contrast, it is pridicted that there will be fewer automobile pmk, which will shrink from 53% of market share to 43% and to 35% in 2050.
While railway is seen the most significant fall in traffic volume percentage wise, it is anticipated that bus will fare better. The former represented 9% of total traffic volume in 1990, but the projected figure for 2050 will be just 4%, a drop of more than 50%. This compared with traffic volume for buses in 2050 of 20% against 26% in 2020, and 29% in 1990.
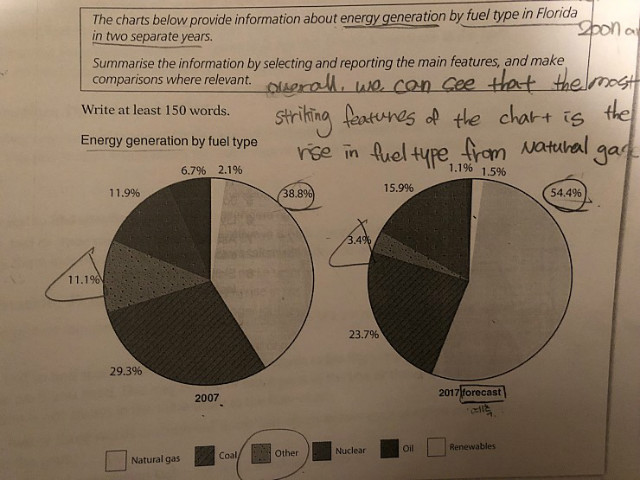
Overall, we can see that the most striking features of chart is the rise in fuel type from natural gas.


- ЁЄ[ХфЗаХф] ILSC - ЧбБЙПЁМ ХУЙш ЙоБт
- ЁЄ[ХфЗаХф] ILSC - ШІЧЊЕх ИЖФЯ ДйГрПРБт
- ЁЄ[ХфЗаХф] ILSC - ИЖЦЎ ДйГрПРБт
- ЁЄ[ХфЗаХф] UMC ОюЧаПј - college ПЊ courtЙцЙЎ
- ЁЄ[ХфЗаХф] UMC ОюЧаПј - ХфЗаХфДыЧаБГ ЙцЙЎ, АРЧ
- ЁЄ[ХфЗаХф] ILSC - ЧСИЎСЈХзРЬМЧ МГИэ ЕшАэ СиКёЧЯ
- ЁЄ[ХфЗаХф] ILSC - International current events
- ЁЄ[ХфЗаХф] SGIC ОюЧаПј - rom
- ЁЄ[ХфЗаХф] SGIC ОюЧаПј - ФЋЛчЗЮИЖ
- ЁЄ[КъИЎСюЙј]ECОюЧаПј - АёЕхФкНКЦЎ ПЉЧр
- ЁЄ[ХфЗаХф] ILSC - ХфЗаХф ЧбРЮ ИЖЦЎ ДйГрПРБт
- ЁЄ[ХфЗаХф] ILSC - communication МіОї, ХфЗаХф ГЛ
- ЁЄ[ХфЗаХф]SSLC - Тї ЗЛЦЎ ЙцЙ§
- ЁЄ[ХфЗаХф] SSLC - < Onnki Donburi КэЗчПЕ ЕЕМАќ
- ЁЄ[ХфЗаХф] ILSC - nordstorm rack БИАцЧЯБт


-
МПяМОХЭ :МПя АГВБИ ХзЧьЖѕЗЮ27Бц 8, 10Уў (ПЊЛяЕП, ПЅХИПі)02-3482-0542
-
УЛСжМОХЭ :УцКЯ УЛСжНУ ЛѓДчБИ ЛчСїДыЗЮ 350ЙјБц 11-2, 3Уў(МЙЎЕП)043-221-0543
-
КЮЛъМОХЭ :КЮЛъБЄПЊНУ КЮЛъСјБИ СпОгДыЗЮ 721-1, 5Уў(КЮРќЕП)051-808-0515
-
УЂПјМОХЭ :АцГВ УЂПјНУ МКЛъБИ ДмСЄЗЮ 9, 12Уў (ЛѓГВЕП, ХфХфНККєЕљ)055-282-9345


-
ЛчРЬЦЎ СЂМгРк ХыАш
-
ПРДУ502ОюСІ325
-
ЧбДо33,515ДЉРћ12,188,897
-
РЯРЯУжАэ94,672ШИПјМі20,299