




[벤쿠버] GV - 파이차트
페이지 정보

본문
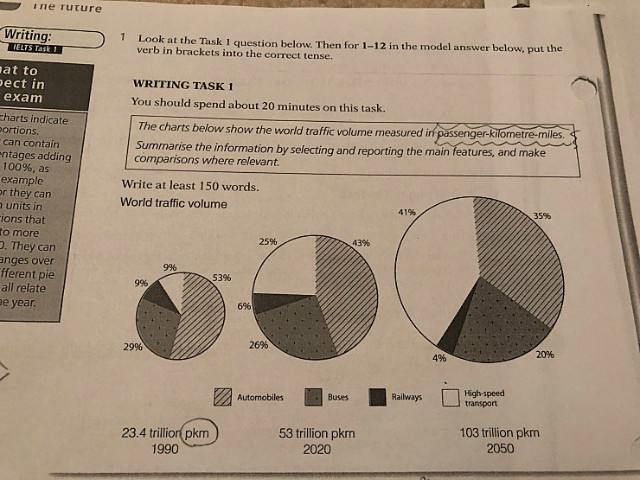
The pie charts illustrate the changes in the proportion of pmk for range of different forms of transport every thirty years between 1990 and 2050 along with the total number of passenger kilometres.
The most striking feature of the chart is the rise in traffic volume from high speed transport. It is expected to see a dramatic increase, climbing from just 9% of traffic volume in 1990 to 25%, and then 41% in2020 and 2050 respectively. By contrast, it is pridicted that there will be fewer automobile pmk, which will shrink from 53% of market share to 43% and to 35% in 2050.
While railway is seen the most significant fall in traffic volume percentage wise, it is anticipated that bus will fare better. The former represented 9% of total traffic volume in 1990, but the projected figure for 2050 will be just 4%, a drop of more than 50%. This compared with traffic volume for buses in 2050 of 20% against 26% in 2020, and 29% in 1990.
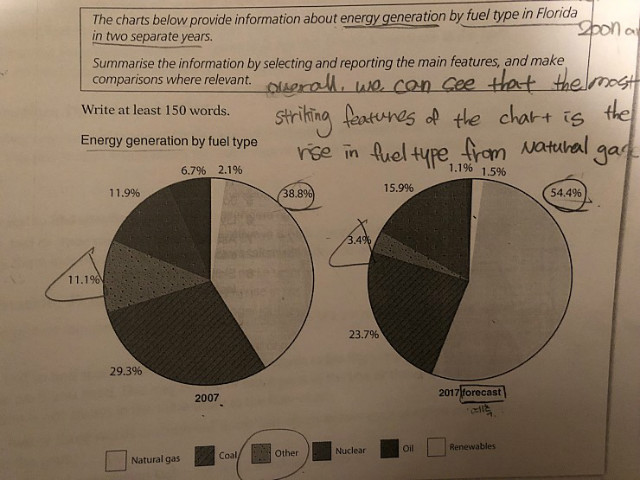
Overall, we can see that the most striking features of chart is the rise in fuel type from natural gas.
댓글목록
등록된 댓글이 없습니다.




 카톡상담신청